On January 29, 2026, Union Finance Minister Nirmala Sitharaman presented the Economic Survey 2025-26 in Parliament. It has been prepared by the Department of Economic Affairs under the guidance of Chief Economic Adviser (CEA) V. Anantha Nageswaran. It projects the Indian economy as a “Macro-Stability Oasis.”
State of the Economy
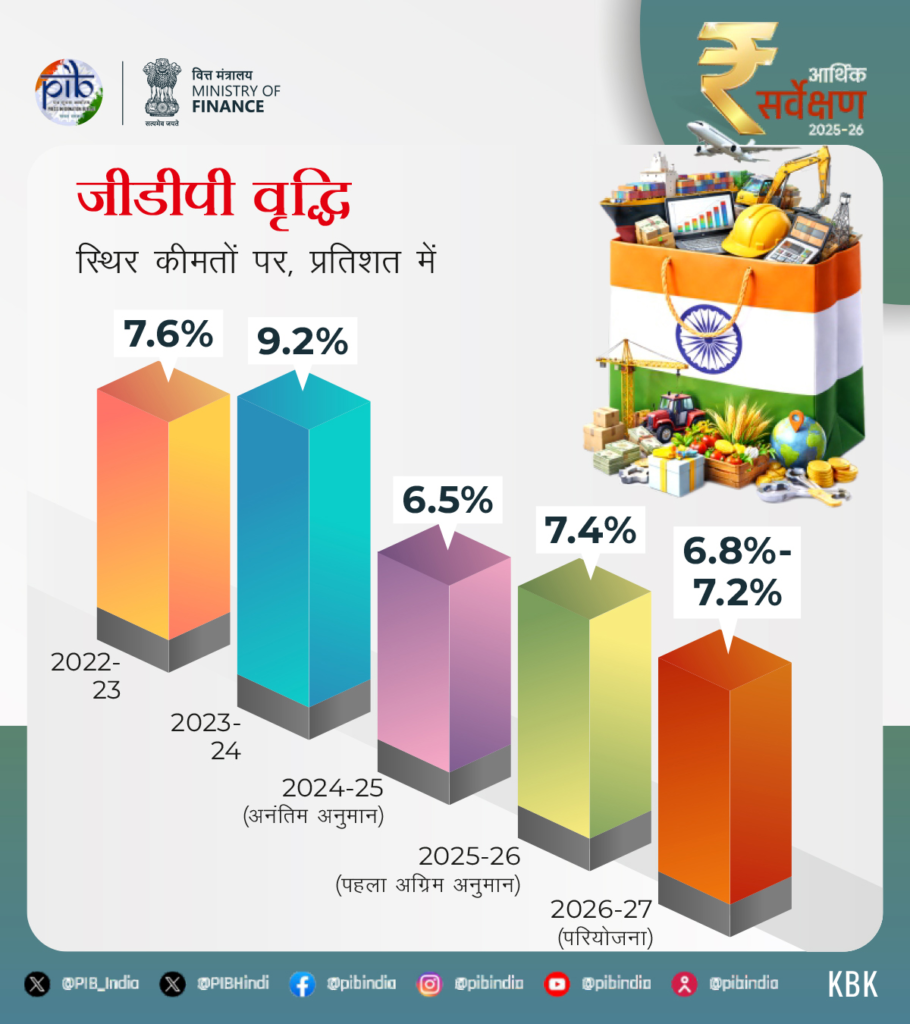
- Despite a challenging global economic environment, India is making remarkable progress. According to advance estimates, Real Gross Domestic Product (GDP) and Gross Value Added (GVA) are projected to grow by 7.4% and 7.3% respectively in FY26.
- The Indian economy is advancing rapidly, driven by improved labor market indicators and robust financial buffers.
- India’s Real Gross Domestic Product growth for FY27 is projected to be between 6.8% and 7.2%.
- During April–December 2025, the inflation rate averaged 1.7%, which is considered to be at an all-time historic low.
- India’s total exports reached USD 825.3 billion in FY25 and touched USD 418.5 billion in the first half of FY26.
- Monetary conditions turned favorable in FY25, keeping the Repo Rate at 5.25% until December 2025.
- Coordinated fiscal, monetary, and structural policies have boosted investment, consumption, and inclusion, thereby strengthening macroeconomic stability.
- The strong performance of the agriculture sector has boosted rural income and consumption, while tax rationalization has improved urban demand.
- India recorded the sharpest decline in headline inflation in 2025 compared to 2024, registering at approximately 1.8%.
- Currently, the Reserve Bank of India’s (RBI) headline inflation forecast for the first and second quarters of FY27 stands at 3.9% and 4%, respectively.
Sectoral Drivers of Growth
Agriculture
- Agriculture and allied activities are boosting rural demand and income security, playing a crucial role in bringing stability to India’s growth cycle.
- A favorable monsoon phenomenon was recorded in the first half of FY26. The sector is projected to grow by 3.1% for FY26.
- Allied agricultural activities, particularly livestock and fisheries, have seen a steady growth of around 5–6%, indicating a relatively stable expansion in these connected sectors.
Industry
- The industrial sector is projected to grow by 6.2% in FY26 compared to 5.9% in FY25. A growth of 6.1% was recorded in the first half of FY25, which is higher than the pre-COVID trend of 5.2%.
- Manufacturing has emerged as a key growth engine. Total GVA growth reached 7.72% in the first quarter of FY26 and scaled up to 9.13% in the second quarter.
- Initiatives launched by the government, especially the Production Linked Incentive (PLI) schemes across 14 sectors, have acted as a catalyst.
- Due to government efforts, investments worth over Rs 2 lakh crore have been attracted across various sectors.
- During this period, incremental production/sales exceeded Rs 18.7 lakh crore, and over 12.6 lakh jobs were generated up to September 2025.
- India’s innovation ecosystem has also strengthened. The country’s rank in the Global Innovation Index improved from 66th in 2019 to 38th in 2025. This solidifies the role of manufacturing-led innovation in long-term progress.
Services
- The services sector is projected to grow by 9.1% in FY26, up from 7.2% in FY25.
- The share of services in GDP rose to 53.6% in the first half of FY26.
- According to the first advance estimates of FY26, its share in Gross Value Added (GVA) has reached an all-time high of 56.4%.
- This reflects the growing importance of modern, tradeable, and digitally delivered services.
- India is now the world’s seventh-largest exporter of services, with its share in global services trade more than doubling from 2% in 2005 to 4.3% in 2024.
- This sector remains the largest recipient of Foreign Direct Investment (FDI). Driven by robust domestic demand and stable export activity, the momentum of the services sector is expected to continue in the coming times.
Employment and Labor Market
- According to the Periodic Labour Force Survey (PLFS), key labor indicators signify a strengthening employment scenario. This showcases the resilience of India’s labor market alongside economic expansion.
- In the second quarter of FY26 (July to September 2025), 56.2 crore people (aged 15 years and above) were employed.
- This reflects the creation of approximately 8.7 lakh new jobs compared to the first quarter of FY26 (April to June 2025).
- The Labour Force Participation Rate (LFPR) for individuals aged 15 years and above increased to 56.1% in December 2025.
- The Female Labour Force Participation Rate rose to 35.3%, indicating growing participation and better inclusion.
- The Worker Population Ratio increased to 53.4%, indicating stable employment inclusion.
- The unemployment rate declined to 4.8% in December 2025. The Annual Survey of Industries (ASI) for FY24 underscores the strength of the organized manufacturing sector.
- As of January 2026, over 31 crore unorganized workers have registered on the e-Shram portal, of which more than 54% are women.
- The National Career Service (NCS) platform has emerged as a key labor market intermediary, boasting over 59 crore registered job seekers and 53 lakh job providers.
- Job vacancies recorded a growth of over 200% in FY24 compared to FY23.
Trade Performance: Export Diversification and Strength in Services
- India’s share in global trade exports increased from 1% in 2005 to 1.8% in 2024.
- This growth has been driven by a significant surge in services exports and steady growth in non-petroleum, non-gems and jewelry exports.
- India’s total exports stood at USD 825.3 billion in FY25, reaching a peak of USD 418.5 billion in the first half of FY26.
- India secured the third position in the Trade and Development Report 2025 by the United Nations Conference on Trade and Development (UNCTAD).
- According to this report, India ranks third among Global South nations in the trade partnership diversification index, following China and the UAE.
- Services exports have emerged as a primary growth engine, reaching an all-time high of USD 387.5 billion in FY25, registering a year-on-year growth of 13.6%.
- This performance has further solidified India’s position as a global hub for technology, business, and professional services.
- As of January 16, 2026, foreign exchange reserves stood at USD 701.4 billion, covering nearly 11 months of imports.
- This covers more than 94% of external debt, strengthening India’s resilience against external vulnerabilities.
- The share of remittances from developed economies increased, reflecting the growing contribution of skilled and professional Indian workers in global labor markets.
- India remains the world’s largest recipient of remittances, with an inflow of USD 135.4 billion in FY25.
Industrial Production
- Industrial activity gathered further momentum in December 2025, positively impacting both the Index of Industrial Production (IIP) and the Index of Eight Core Industries (ICI).
- The Index of Eight Core Industries (ICI) serves as a leading indicator of industrial performance and comprises 40.27% of the total weight of the IIP.
- IIP registered a growth of 7.8% in December 2025, hitting its highest level in the last two years. This follows a robust growth of 7.2% in November 2025.
- The manufacturing sector remained the primary growth driver, expanding by 8.1%, while mining and electricity sectors recorded growths of 6.8% and 6.3% respectively.
- Within manufacturing, high-performing technology and mobility-related segments stood out, with remarkable growth seen in computers, electronic, and optical products (34.9%), motor vehicles, trailers, and semi-trailers (33.5%), and other transport equipment (25.1%).
- Cement production grew by 13.5% year-on-year, while steel recorded a 6.9% increase. This growth reflects sustained demand from construction and infrastructure activities.
- Other core sectors like electricity (5.3%), fertilizers (4.1%), and coal (3.6%) also recorded positive growth, fueling the recovery in energy and input-intensive industries.
- Coordinated improvements in IIP and ICI point to robust industrial fundamentals, driven by infrastructure building, resilient domestic demand, and manufacturing activity.
Fiscal Progress
- The government’s prudent fiscal management has enhanced credibility in India’s macroeconomic and fiscal framework.
- Consequently, this led to improved ratings from Morningstar DBRS, S&P Global Ratings, and Rating and Investment Information (R&I) Inc., resulting in three sovereign credit rating upgrades in 2025.
- The Centre’s revenue receipts rose from an average of around 8.5% of GDP in FY16-20 to 9.2% of GDP in FY25.
- This was primarily driven by a surge in non-corporate tax collections, which expanded from around 2.4% of GDP pre-pandemic to nearly 3.3% post-pandemic.
- The share of direct taxes in total taxes increased from 51.9% pre-COVID to 55.5% post-COVID, reaching 58.8% in FY25 (PA).
- Over the same period, the direct tax base expanded consistently, with the number of income tax return filers increasing from 6.9 crore in FY22 to 9.2 crore in FY25.
- This reflects better compliance, extensive use of technology in tax administration, and rising income levels bringing more individuals into the tax net.
- Gross GST collections during April–December 2025 stood at Rs 17.4 lakh crore, representing a year-on-year growth of 6.7%.
- This growth is broadly in line with GDP expansion and signifies accelerating economic activity across the Indian economy.
- Cumulative e-way bills during this period surged by 21% compared to the previous year.
- India has reduced its general government Debt-to-GDP ratio by approximately 7.1 percentage points since 2020 while sustaining high levels of public investment.
- The government’s total capital expenditure scaled up from an average of 2.7% of GDP pre-pandemic to nearly 3.9% post-pandemic, reaching 4% of GDP in FY25.
- The combined fiscal deficit of state governments rose to 3.2% of GDP in FY25, reflecting emerging pressures on state finances.
- Notably, during the post-pandemic period, the combined fiscal deficit of state governments remained stable at around 2.8% of GDP, comparable to pre-pandemic levels.
Building a Balanced Financial Ecosystem
- The global financial environment is changing rapidly. India remains economically strong owing to its institutional resilience and increasing reliance on domestic financial sources.
- Robust monetary management has also kept India’s economy secure and stable amidst global economic challenges.
- During FY26 (April–December 2025), India’s monetary and financial sectors put up a strong performance.
Monetary Policy Actions and Liquidity Management
- Keeping the evolving macroeconomic and financial landscape in view, the Reserve Bank of India’s (RBI) Monetary Policy Committee reduced the Repo Rate by a cumulative 100 basis points between April and December 2025.
- These cuts aim to facilitate credit flow, investment, and overall economic activity.
- To complement the policy rate cuts, the RBI reduced the Cash Reserve Ratio (CRR) by 100 basis points to 3.0% during September–November 2025.
- Concurrently, the RBI injected durable liquidity worth Rs 2.39 lakh crore through Open Market Operations (OMO) during April–May 2025.
- This was followed by an additional OMO purchase of Rs 1 lakh crore and a USD 5 billion 3-year USD/INR buy-sell swap transaction in December 2025.
- As a result, systemic liquidity remained in surplus during FY26 (up to January 8, 2026), averaging Rs 1.89 lakh crore, compared to Rs 1,605 crore in FY25.
Monetary Aggregates and Credit Transmission
- Reserve money growth slowed down from 4.9% as of December 2024 to 2.9% by December 2025.
- The Cash Reserve Ratio (CRR)-adjusted growth stood at 9.4% compared to 6.2% in the previous year, reflecting an expansionary monetary policy stance.
- During the same period, broad money growth accelerated to 12.1% from 9% a year ago, indicating that banks effectively deployed the liquidity released by the CRR cuts.
- This trend was primarily driven by an increase in aggregate deposits with banks, which forms the largest component of broad money.
- The Money Multiplier increased from 5.70 a year ago to 6.21 in December 2025, pointing to enhanced financial intermediation by the banking system.
Banking Sector Performance and Credit Dynamics
- The banking sector strengthened further in FY26, with the Gross Non-Performing Asset (GNPA) ratio declining to a multi-decade low and Net NPA hitting record lows.
- The Capital-to-Risk Weighted Assets Ratio (CRAR) of Scheduled Commercial Banks (SCBs) remained robust at 17.2% as of September 2025.
- Profit After Tax (PAT) for SCBs grew by 16.9% in FY25 and increased by 3.8% year-on-year up to September 2025.
- Return on Equity (RoE) stood at 12.5% and Return on Assets (RoA) at 1.3% in September 2025.
- Outstanding credit to micro and small enterprises accelerated to 14.5% (YoY) in December 2025 from 11.2% in December 2024.
- December 2025 recorded the highest annual growth rate for both bank credit and non-food credit in FY26.
- Credit growth to MSMEs remained robust and sustained its upward momentum, expanding by 21.8% in November 2025.
- Within this sector, micro and small enterprises recorded a year-on-year growth of 24.6% in November 2025 compared to 10.2% in November 2024.
Improvement in Financial Inclusion Parameters
- The RBI’s Financial Inclusion Index measures the progress made toward financial inclusion in the country.
- It captures data across 97 indicators covering banking, investments, insurance, postal, and pension sectors based on three dimensions—Access, Usage, and Quality.
- India’s Financial Inclusion Index improved from 64.2 in March 2024 to 67.0 in March 2025.
Capital Markets and Domestic Financialisation
- The role of capital markets in capital formation continues to expand. During FY26 (up to December 2025), resources totaling Rs 10.7 lakh crore were raised from primary markets.
- Over the last five years, from FY22 to FY26 (up to December 2025), primary markets raised a cumulative Rs 53 lakh crore through equity and debt issuances.
- The share of retail investors in equity rose to 18.8% by September 2025, and domestic equity assets grew by nearly Rs 53 lakh crore between April 2020 and September 2025.
- The share of equity and mutual funds in annual household financial savings expanded from around 2% in FY12 to over 15.2% in FY25.
Environment and Climate Change
- India aims to become a developed nation by 2047, which necessitates achieving high, inclusive, and environmentally sustainable growth.
- To this end, emphasis is being placed on shifting consumption and production patterns, alongside technological and policy interventions.
- Mission Lifestyle for Environment (Mission LiFE) highlights the significance of behavioral shifts and citizen participation in India’s approach to climate action and sustainability, working alongside government-led mitigation and adaptation efforts.
- Although India’s per capita emissions remain significantly below the global average, climate change still poses risks to livelihoods, infrastructure, and economic stability.
- Adaptation is a core element of India’s climate strategy, driven predominantly by public investment and community-based action.
- India is also pursuing a balanced mitigation pathway by scaling up renewable energy, battery storage, and nuclear power, aligned with its objectives of energy security and industrial competitiveness.
- Inadequate global capital flows remain a major constraint for a developing nation like India, underlining the urgent need for reforms in multilateral financial institutions and the strengthening of domestic financial systems.
Development of AI Regime/Ecosystem in India
Artificial Intelligence (AI) is transforming the global economy, and India is pursuing a practical strategy amidst rapid technological changes and continuous global uncertainties.
India’s AI strategy is grounded in its economic realities, taking into account constraints related to capital, computing capacity, energy, and infrastructure. Adopting a bottom-up approach under a unified vision, India aims to harness AI’s potential to provide a source of dignified employment for its youth.
The development of AI in India is envisioned to be based on open and interoperable systems to foster collaboration and shared innovation. This aligns well with India’s strengths in human capital, data diversity, and institutional coordination.